KE logo
menu
homehome home home home home home home home home
MAXIMUM DIFFERENCE SCALING

MaxDiff is an approach for obtaining preference/importance scores for multiple items. Although MaxDiff shares much in common with conjoint analysis, it is easier to use and applicable to a wider variety of research situations. MaxDiff is also known as "best-worst scaling".
Research has shown that MaxDiff scores demonstrate greater discrimination among items and between respondents on the items.

HOW DOES THIS BENEFIT YOU?

MaxDiff is an approach for obtaining preference/importance scores for multiple items (brand preferences, brand images, product features, advertising claims, etc.) using marketing or social survey research.

MaxDiff (best-worst scaling) experiments
Method of Paired Comparisons (MPC) experiments (choices from pairs)
Choices from subsets of three items, four items, etc.
COMMON APPLICATION INCLUDE
Message testing
Brand preference
Customer satisfaction
Product features
DESIGNING A MAX DIFF STUDY

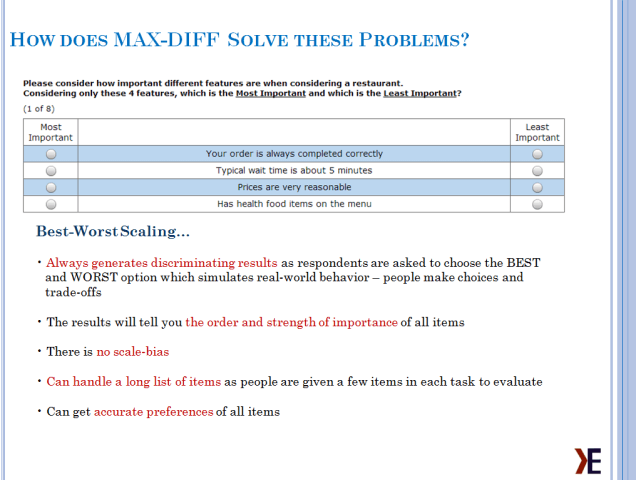
There are four features of a MaxDiff design that make it such an outstanding tool

Frequency balance
Each item appears an equal number of times as every other item.
Orthogonality
Each item appears an equal number of times with every other item.
Positional balance
Each item appears an equal number of times in the first, second, third, etc., positions within the set.
Connectivity
Each item should be directly or indirectly compared to every other item in the study. It allows all items to be placed on a common scale.

Steps to Design a Max Diff Study

Step 1
Develop attribute list, including possible prohibitions.
Step 2
Decide the number of items per set, the number of sets per respondent, and the number of versions of the questionnaire.
Step 3
Generate Max Diff Design
Step 4
Decide if anchoring is necessary. Anchoring lets you draw a line between important and unimportant items.
TYPES OF MAX DIFF STUDY

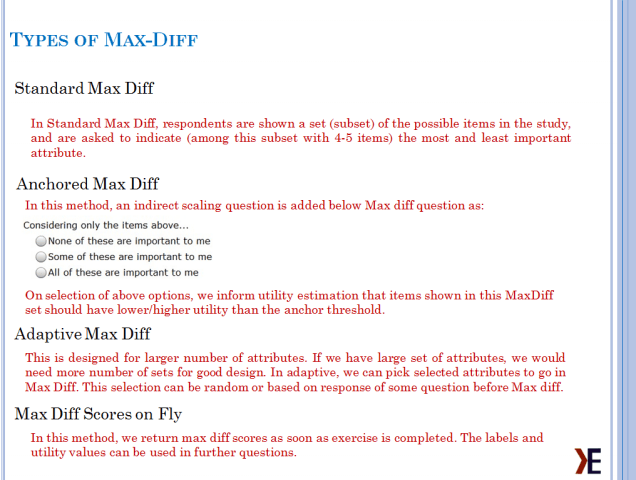
At Knowledge Excel, we have the experience to work on various types of Max Diffs like:

Augmented MaxDiff
Additional ranking, rating, or sorting tasks are completed outside the MaxDiff exercise and then added (augmented) as new choice tasks to each respondent's MaxDiff data for utility estimation. For example, respondents might be asked to rank-order the 6 items chosen "best" across the previous 6 MaxDiff sets. The rank-order judgments may be exploded into paired comparisons (or other related coding approaches) for those 6 items and added to the choice data set. Augmented approaches can lead to even more accurate measurement of the top few items for each respondent, assuming the augment focuses on obtaining more information about best items. Other augmentations are possible and have been proposed, including augments that focus on obtaining more precision for the worst few items. Typical analysis is HB-MNL; aggregate logit or latent class MNL may also be used.
Tournament MaxDiff
Originally called "Adaptive MaxDiff" by the author (Orme) in 2006, but to avoid confusion it's probably easier to think of it as Tournament MaxDiff, because it proceeds similar to a round-robin tournament in sports competitions. For each respondent, items that are selected "worst" are dropped from that same respondent's later MaxDiff sets. Later sets compare winners vs. winners, until an overall winning item is identified. The sets can decrement in complexity, from 6 items at a time, to 5 items, etc. until a final ranking is done among the remaining 2, 3, or 4 winning items. The utilities are typically estimated via HB-MNL, though aggregate logit and latent class MNL are also possible. The benefits include increased respondent engagement in the exercise and improved accuracy at the individual level for the best items per respondent.
Anchored MaxDiff
Most MaxDiff approaches lead to relative (ipsative) scores such that we don't know whether any of the items is good or bad in any absolute sense. This often isn't a big issue, especially if a wide variety of items have been included in the experiment. With Anchored MaxDiff, we can establish whether each of the items is above or below some threshold anchor representing an important/not important, good/bad, or buy/not buy threshold. For anchoring, we ask additional questions wherein respondents indicate whether selected items are important/not important, good/bad, etc. Respondents do not need to evaluate all items with respect to the anchor. The additional anchoring questions are added to the choice data set as additional comparisons vs. the "anchor item" (threshold). Utility estimation may be done with HB-MNL, aggregate logit, or latent class MNL. The utility of the anchor threshold is typically set to zero, such that items with positive utilities indicate that they are important, good, or a "buy." Items with negative utilities indicate items that are not important, not good, or not a "buy." Anchored MaxDiff may be combined with any of the other six flavors of MaxDiff described in this article.
Sparse MaxDiff
Used when the number of items is about 40 or more. The approach involves showing each item to each respondent about 1 or fewer times. For example, with 60 items in the study, 15 sets per respondent and 4 items per set, each item can show 1x per respondent. Or, with 120 items in the study, 15 sets per respondent and 4 items per set, it then takes 2 respondents to show each item once. Because the data are so sparse (or even missing) at the individual level, we estimate scores typically via pooled analysis such as aggregate logit or a latent class MNL. However, some authors have shown that HB-MNL can do a reasonable job even if each item is shown just 1x per respondent. (Though more accurate estimates certainly could be obtained by showing each item 2x or 3x per respondent.)
Express MaxDiff
Used when the number of items is about 40 or more. The approach involves randomly (or via a blocked design) drawing a subset of the items (such as 30 out of 60 items) for each respondent such that each item drawn per respondent can be shown 2x or 3x to each respondent. There are two potential advantages for Express MaxDiff over Sparse MaxDiff: 1) respondents don't need to orient themselves to so many items within the same questionnaire leading to some potential cognitive efficiencies, 2) if running HB-MNL, a fit statistic (RLH) can be computed for each respondent leading to the possible identification of inconsistent respondents. Despite these potential benefits, we've found under a variety of tests that Express MaxDiff performs a bit worse than Sparse MaxDiff. The typical approach for analysis is aggregate logit to summarize scores for the sample.
Bandit MaxDiff
Used when the number of items is about 50 or more, extending potentially into the 100s of items. Like Express MaxDiff, we draw a subset of the items (such as 30 out of 60 items) for each respondent such that each item drawn per respondent can be shown 2x or 3x to that respondent. Unlike Express MaxDiff, this is an across-respondents adaptive approach that draws items for respondents (using Thompson Sampling) that have tended to be preferred by earlier respondents. Thus, better items for the population are oversampled dramatically compared to worse items. When the goal is to identify the top few items for the population, Bandit MaxDiff can be 2x to 4x more efficient than Sparse or Express MaxDiff.

Wish to know more about Bandit Max diff. Watch this video

MAX DIFF DATA / UTILITIES

MaxDiff data involve choices: respondents are shown items and asked to choose among them. This kind of data is very useful in marketing and social research applications.

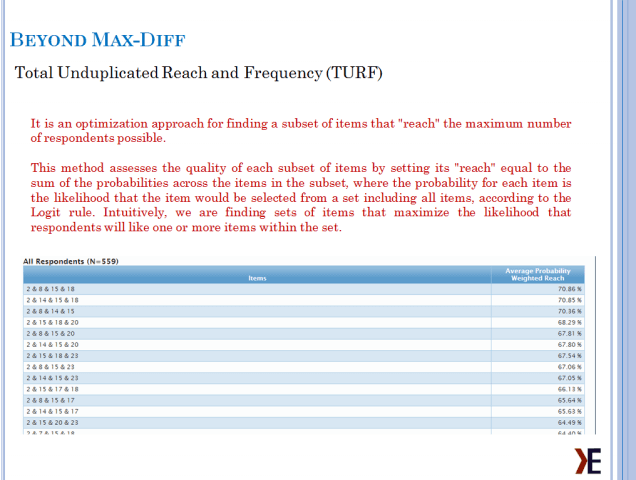
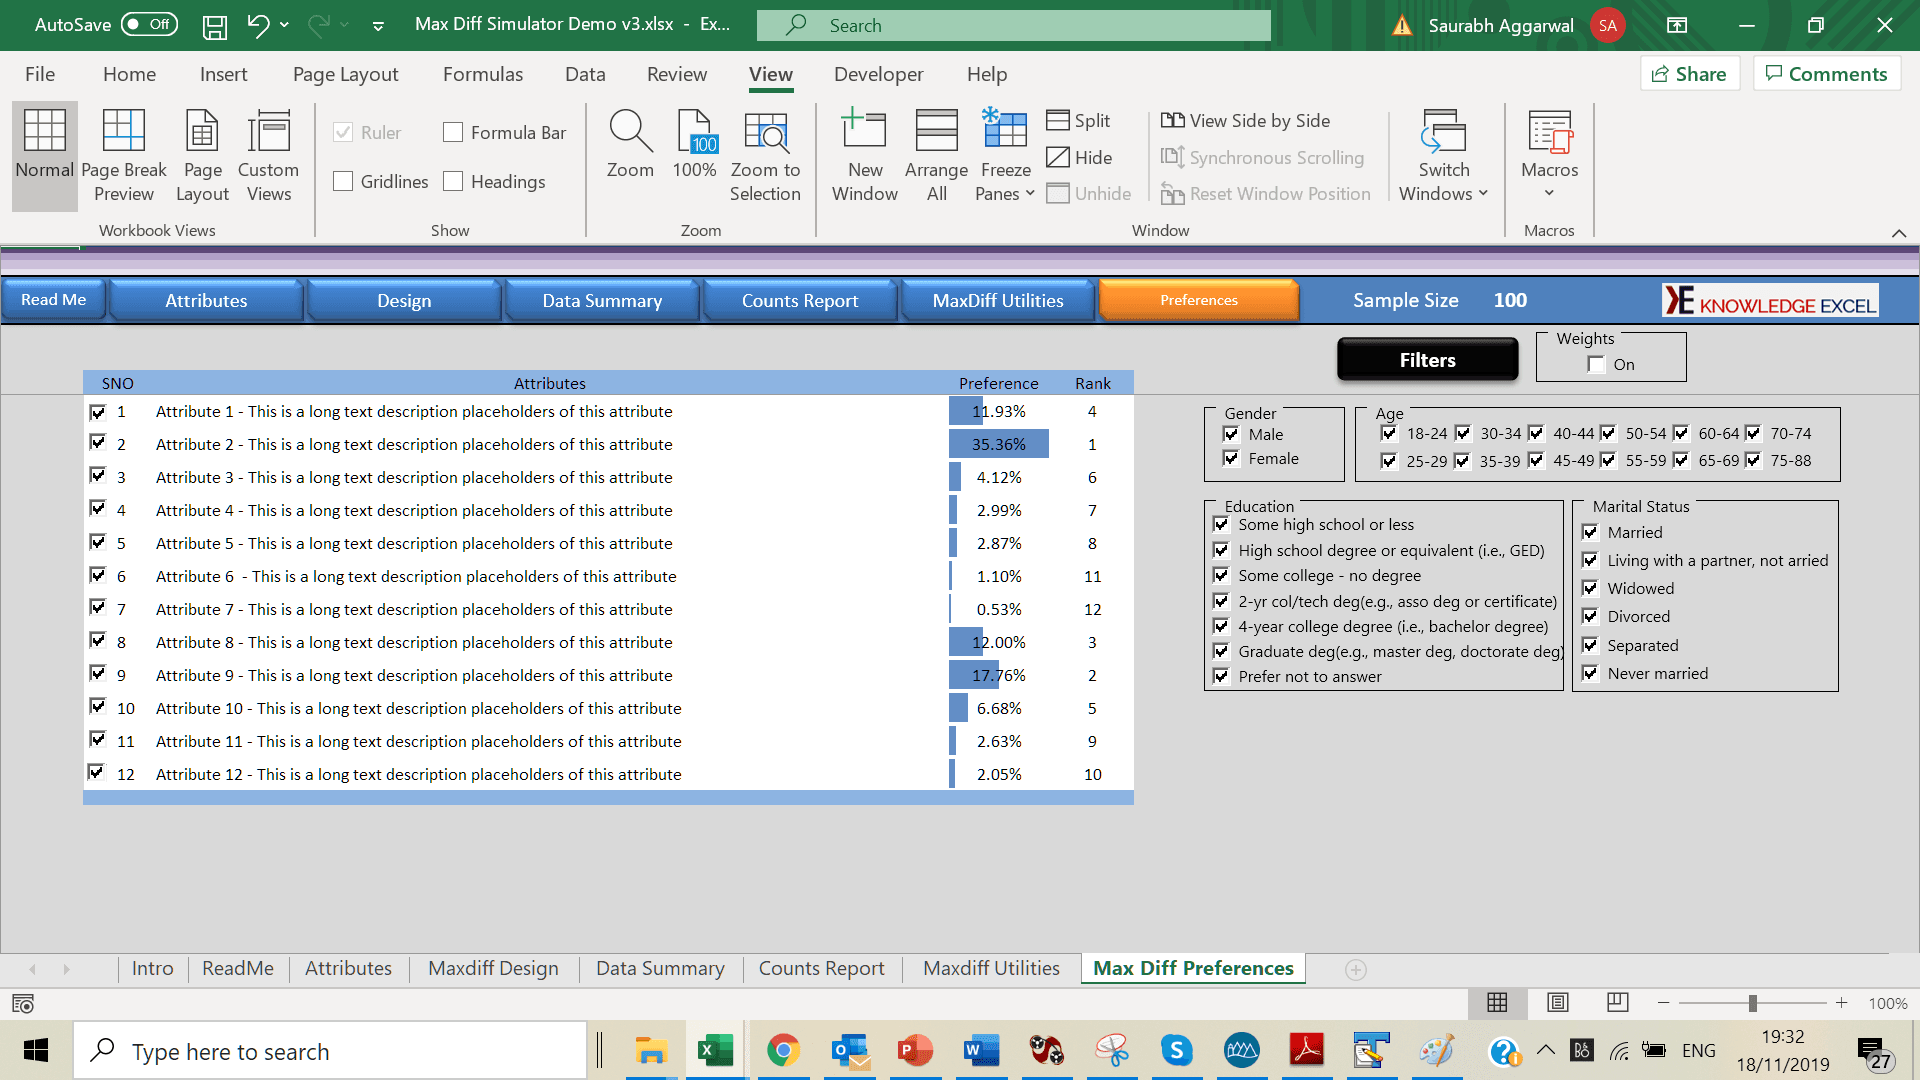
The analysis of this data involves observing the probabilities of choice for the items. These probabilities are represented as customers preference for each item that can be used to rank and/or index these items for relative comparison. Generally it is preferred to index by the highest preferred item, but results can be indexed from average or lowest preferred item as well.

Four types of analysis are offered in the MaxDiff System:

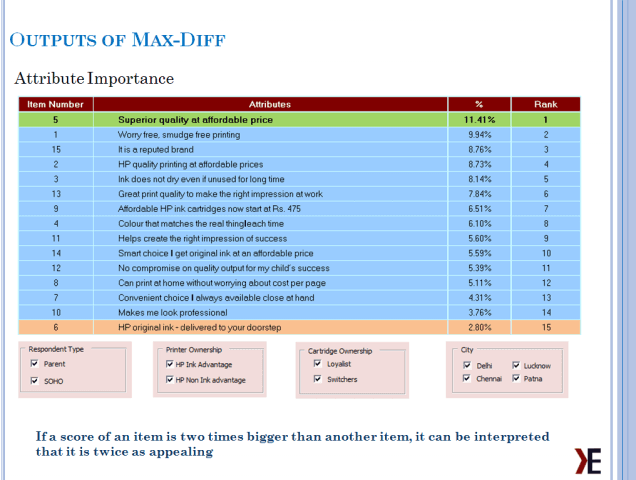
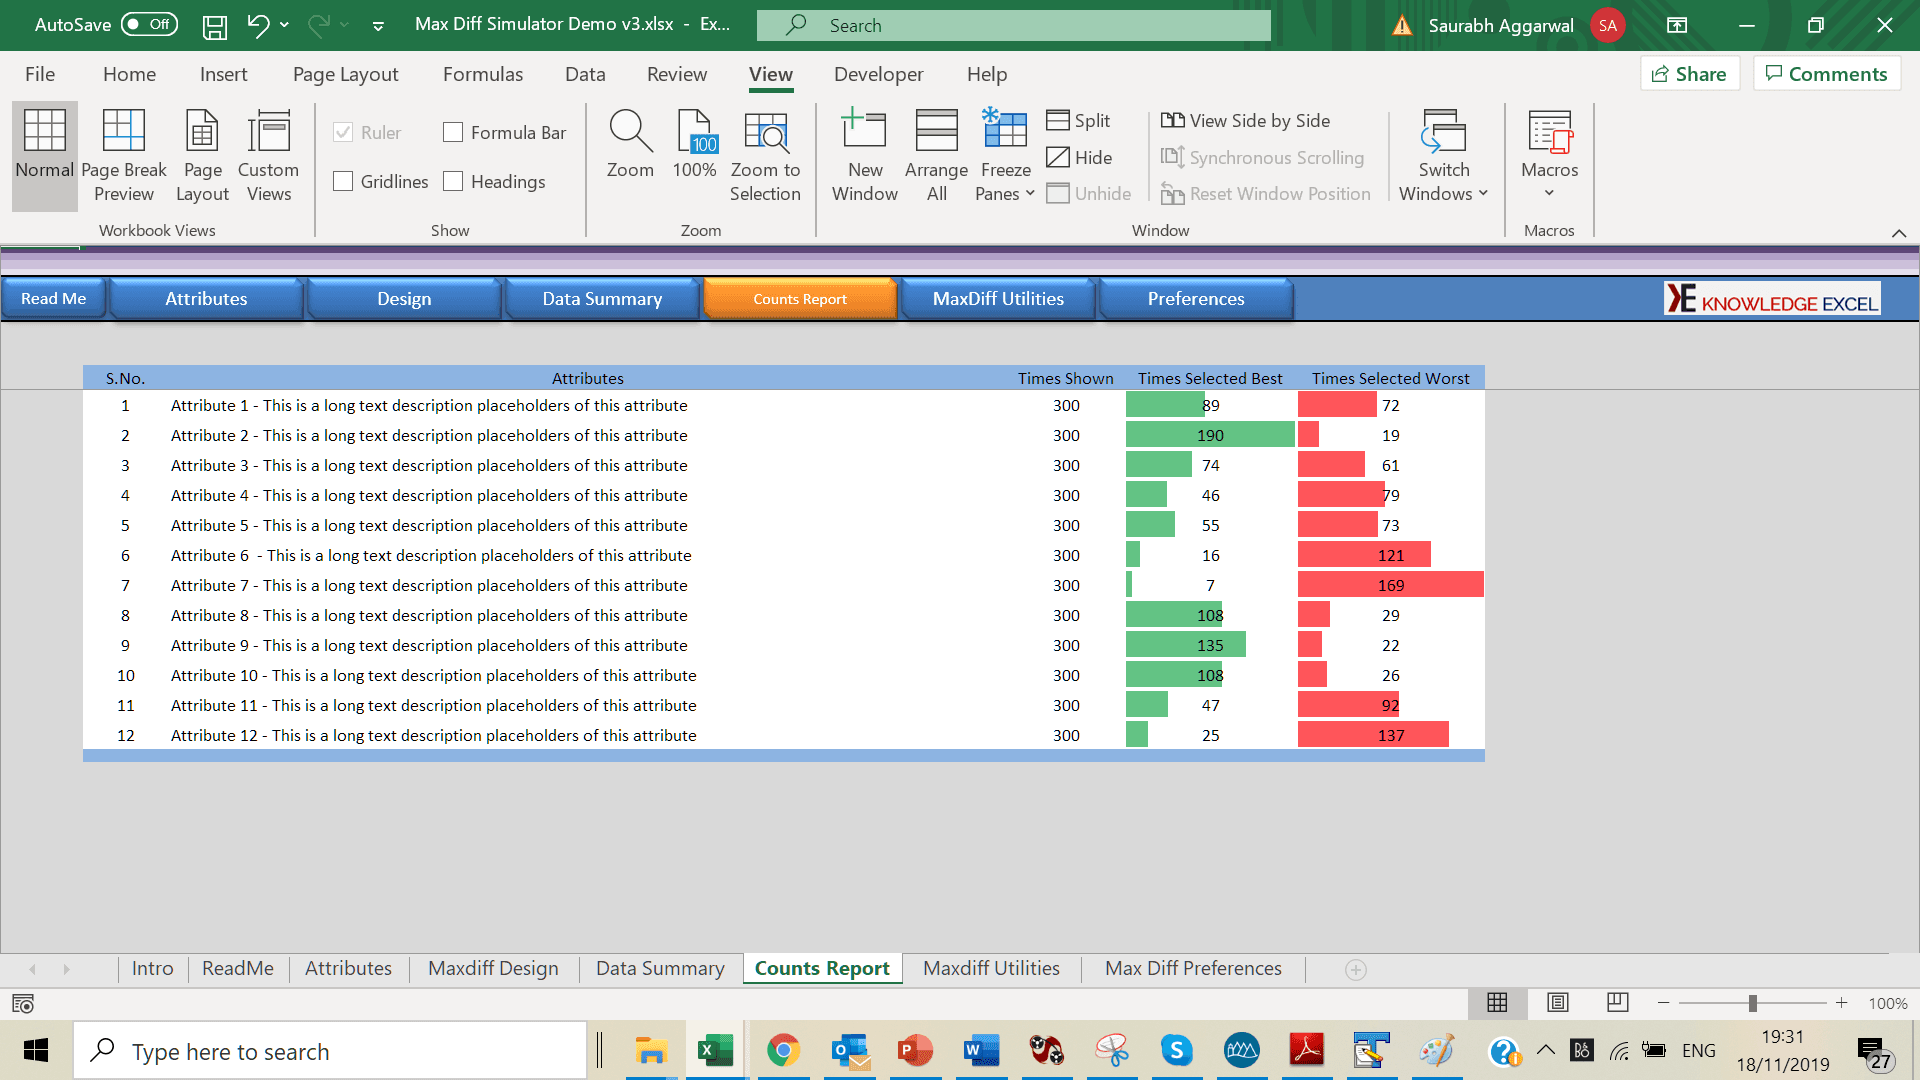
  • Counting Analysis: Counting analysis takes into account how often each item was available for choice, and how many times it was selected as best or worst.

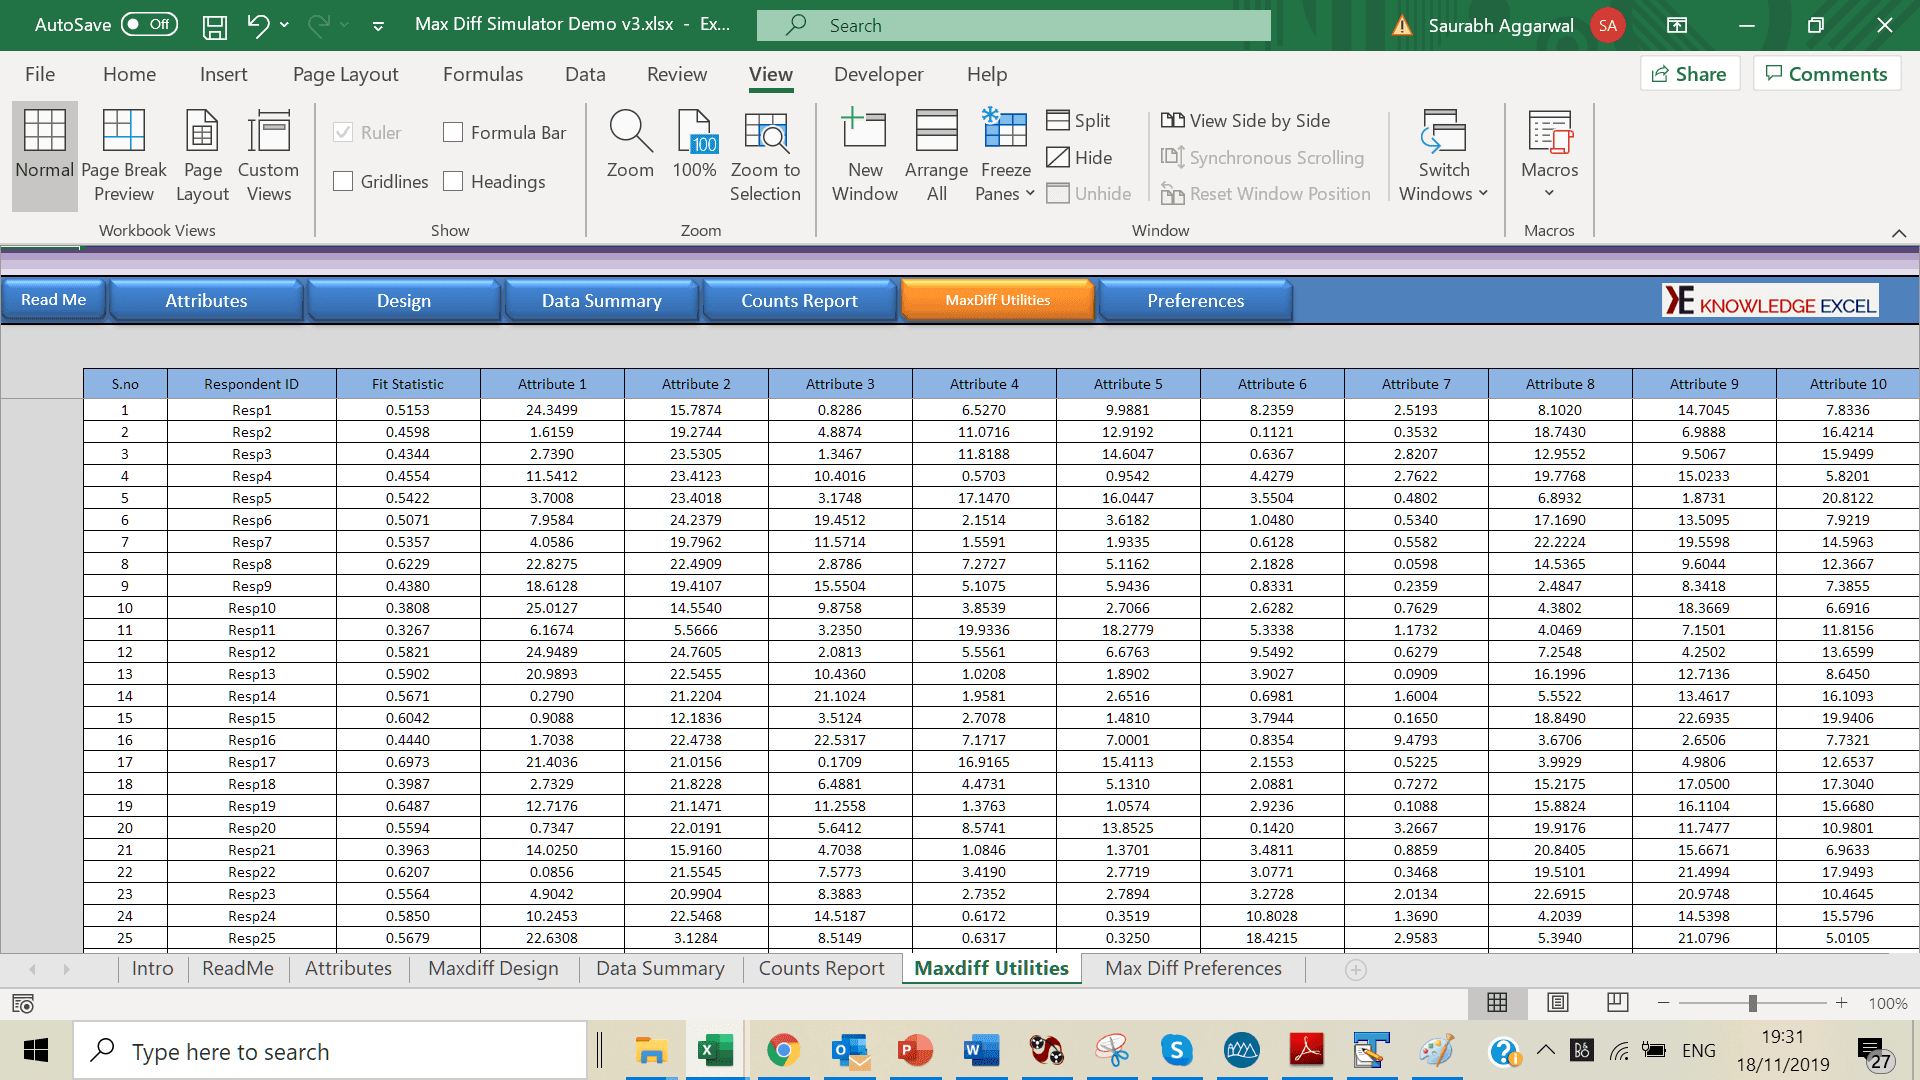
  • Individual-Level Score Estimation: MaxDiff uses a sophisticated HB estimation technique to produce scores for each respondent on each item. The HB estimation routine is able to stabilize the estimates for each individual by "borrowing" information from the body of respondents in the same data set.

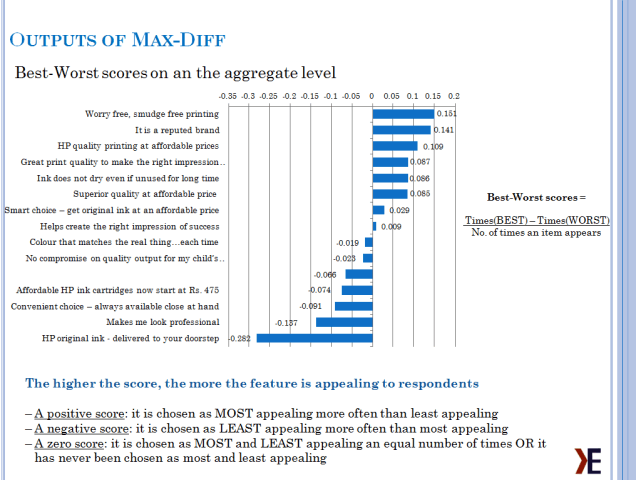
  • Aggregate Score Estimation via Logit: Aggregate Logit has been used for more than three decades in the analysis of choice data. It is useful as a top-line diagnostic tool (both to assess the quality of the experimental design and to estimate the average preferences for the sample). Logit can be quite useful for studies in which you are studying very many items and where respondents cannot see each item enough times to support individual-level analysis of scores via HB.

  • Latent Class Estimation: Latent Class is often used to discover market segments (for use as banner points) from MaxDiff data. Segment membership is reported on the Segment Membership tab of the output.

MAX DIFF SIMULATOR

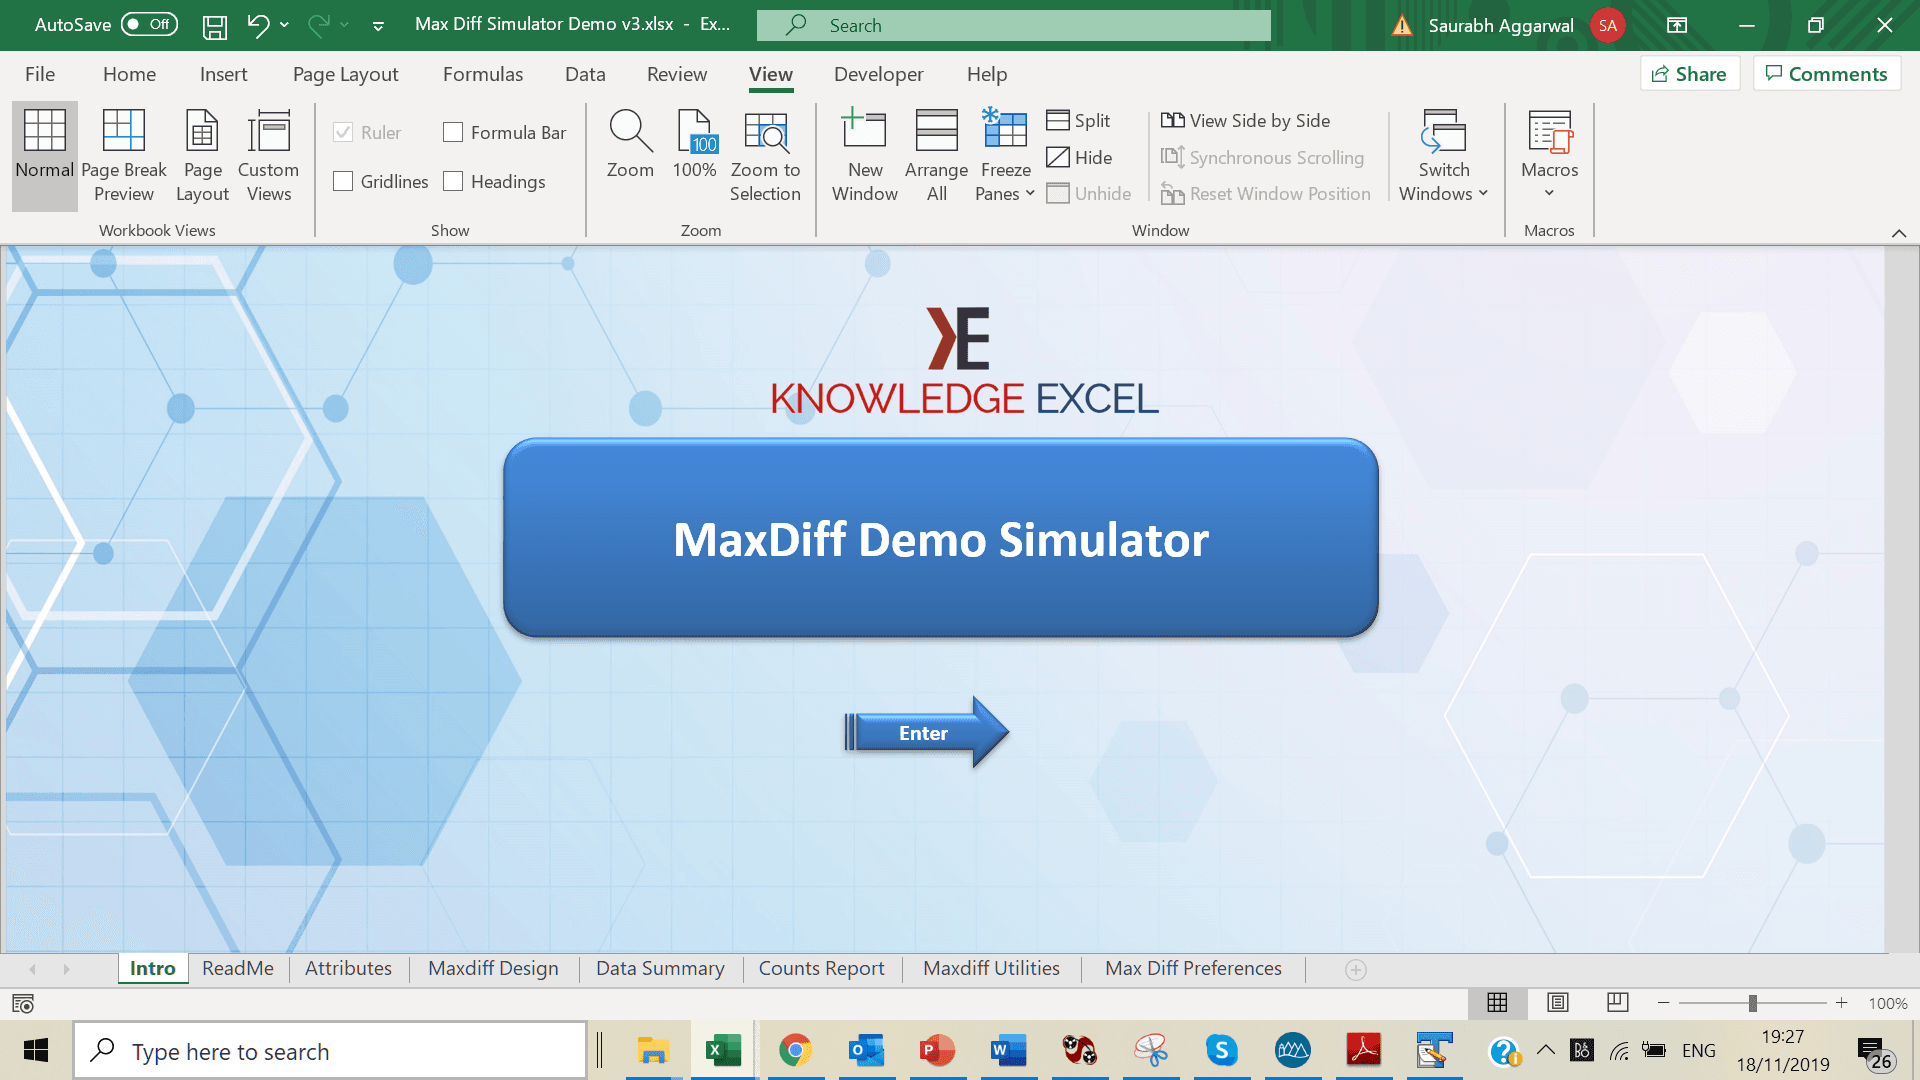
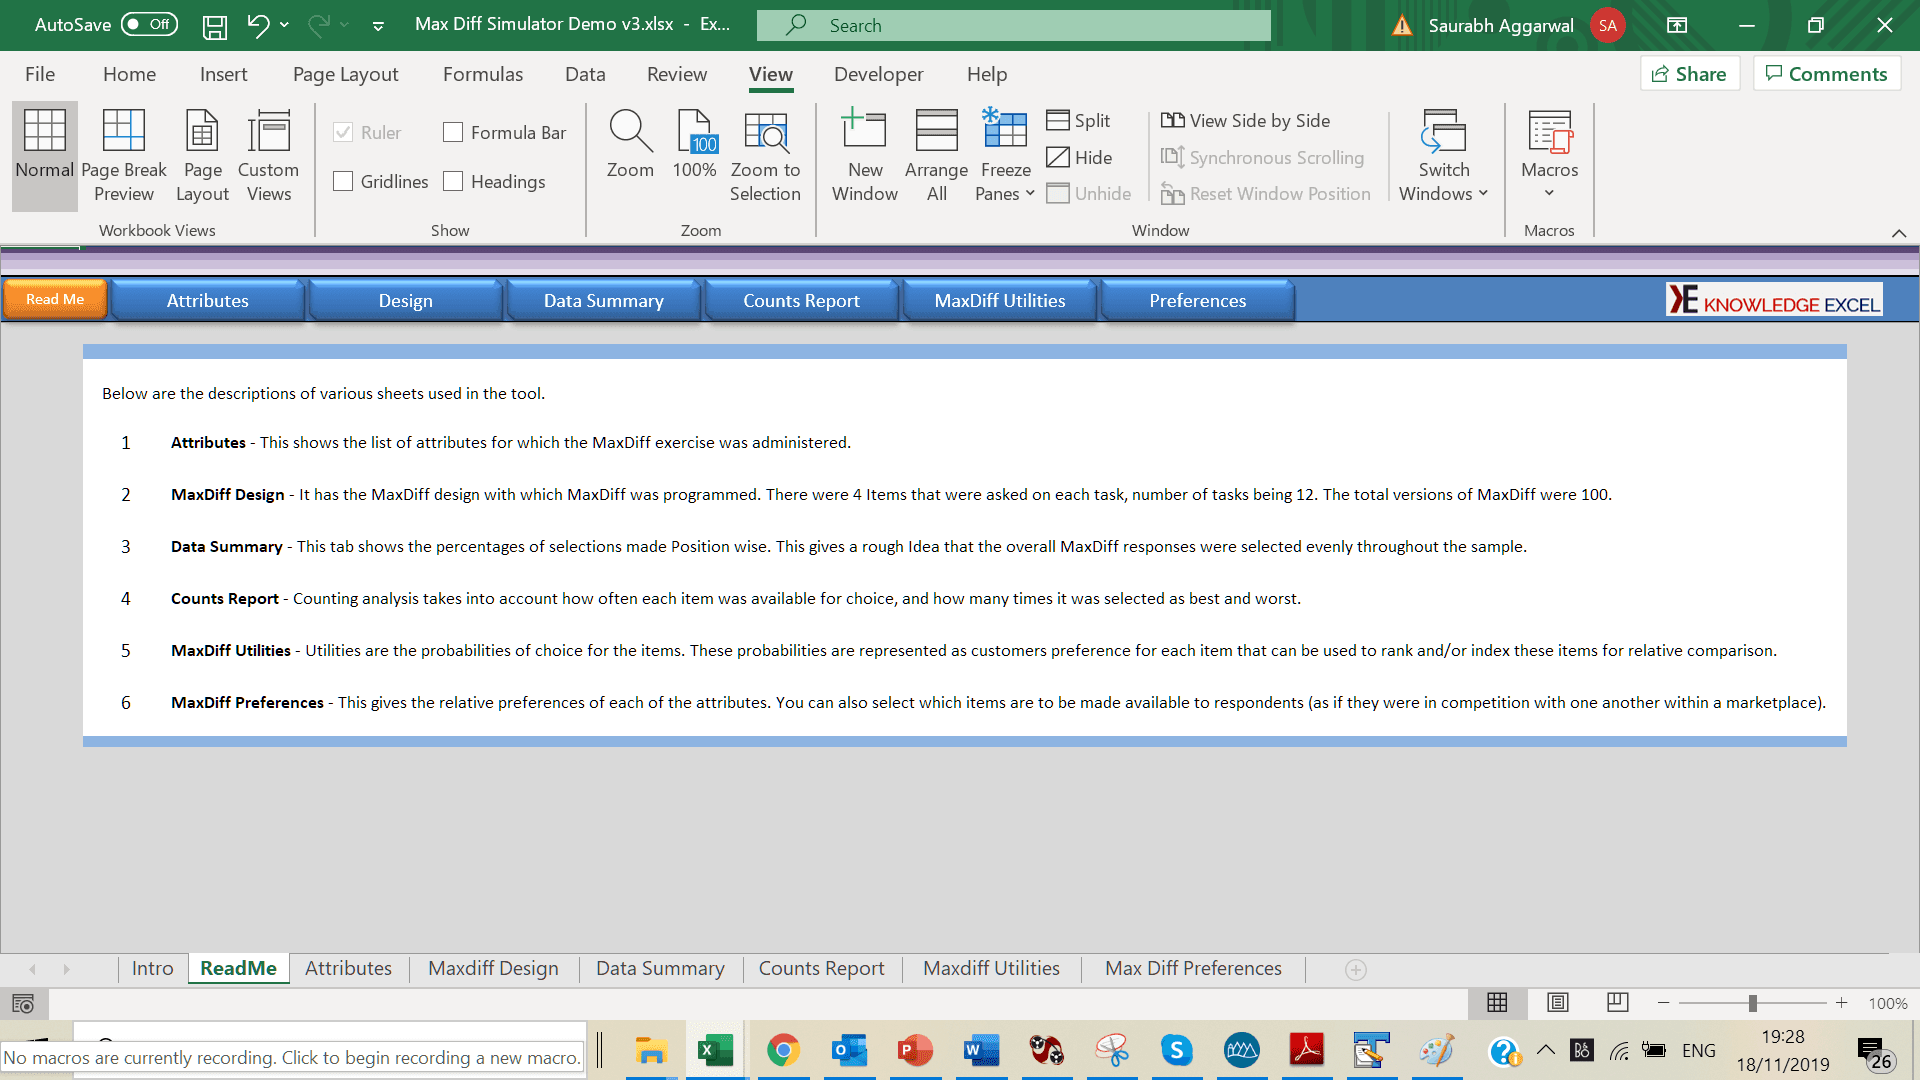
The simulator is a stand-alone package that allows clients to conduct alternative bwhat-ifb scenarios. Developed in Excel, a simulator is a powerful analysis tool and the most important deliverable resulting from a max diff project.

The max diff simulator is an effective tool for computing preference share, counts report, average utilities etc. You can also select which items are to be made available to respondents (as if they were in competition with one another within a marketplace).

Simulators transform the utility data from your max diff study into a tangible tool that you and your end-clients can use. Because it is in Excel, you can easily share it with colleagues and end-clients to maximize use.

Cloud Based Simulator

CASE STUDIES

Fast Food Chain want to decide the menu option to launch next season.

Client/Background
Every year, Brand X launches new products and flavours for food lovers and give them another reason to visit the restaurant.
Business Problem
They have come up with 30 prospective menu option in form of concepts and wish to test the likeability of these.
Our Solution
We recruited current customers and prospect customers of fast food, introduced them with the concepts and did a max diff study wherein we showed 5 concepts on a screen & asked which food item they liked the most and which they liked the least. From this exercise, we calculated share of preference and computed rank order of the menu options.
Outcome
The client is able to identify the food items which will be preferred the most. We further did TURF analysis on max diff data to identify reach of each item and bundle which can be launched to capture maximum number of people.
REFERENCE BOOK

If you are looking for a reference book on Max Diff, we highly recommend you to read book on Applied MaxDiff written by Keith Chrzan and Bryan K. Orme. For more information click here

MAX DIFF EXAMPLES
Webinar